Aleksey Shipilёv, JVM/Performance Geek, ![]()
Shout out at Twitter: @shipilev
Questions, comments, suggestions: aleksey@shipilev.net
Motivation
This new system had replaced the build server producing OpenJDK builds. Previous build server is i7-4790K, which is loaded ~60%, and sometimes flatlines at 100% load, even without aggressive test suites. So, whatever additional capacity the new build server brings, it can consume it all: we can add more testing if capacity is available.
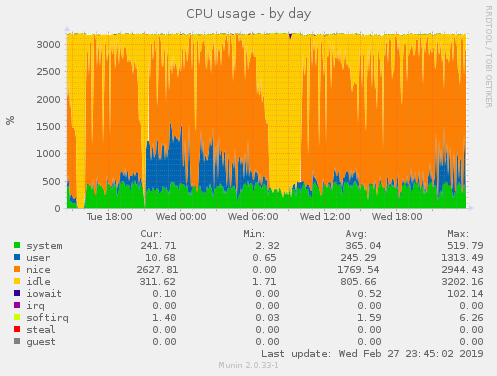
Therefore, I am expecting to run the machine at full blast 24/7/365. Fast-forward, this is the machine 3 months in:
Experimental Setup
This is what we have:
Sensors:
-
Domestic power meter at wall socket
-
"sensors" loop to poll peak temperature during the build, measuring Tdie (which is supposed to be real chip temp)
-
"cpupower monitor" to monitor effective CPU frequency during the build
-
Ears to get the subjective loudness of CPU fan
Tests:
-
OpenJDK fastdebug build: decently recent jdk/jdk workspace, configured with default options
This is the target workload for this server. OpenJDK build combines multiple C, C++, Java compilations linkage, and packaging, at varying degrees of parallelism.
Since parallelism varies during the build, the power taken by the build is not constant, and it is only stable when the first massive bulk of work is done. Therefore, power/energy calculations for this test may be off. It would be more accurate to measure the delivered energy directly, but my domestic power meter is way too innacurate to capture this for a single build, and I have no time doing each build many times.
Each build is done 3 times in a row to check the results converge. The average is taken then, and standard error is checked to be below 5%.
-
Linux Kernel: compiling Linux Kernel 4.4 with -j 32
This test is done with the help of kcbench tool, which does 3 compilations in the row. This test is heavily parallel, and have almost no sequential phases. This means it might be the most accurate measure of full-blast power when multiple builds are running on the machine.
Raw Data
Idle |
OpenJDK fastdebug |
Linux Kernel |
||||||||||
|---|---|---|---|---|---|---|---|---|---|---|---|---|
Mode |
Power |
Time |
Power |
Temp |
Energy |
Time |
Power |
Temp |
Energy |
Effective Freq |
Fan |
|
Baseline |
||||||||||||
1 |
Base |
40 W |
175 s |
230 W |
54 oC |
40.2 kJ |
34.5 s |
225 W |
53 oC |
7.8 kJ |
3800 MHz |
LOUD |
Messing with Package Power Threshold (PPT) |
||||||||||||
2 |
PPT=125W |
40 W |
188 s |
160 W |
51 oC |
30.8 kJ |
35.9 s |
160 W |
51 oC |
5.4 kJ |
<varies> |
Loud |
3 |
PPT=100W |
40 W |
185 s |
140 W |
46 oC |
27.3 kJ |
37.6 s |
140 W |
50 oC |
4.1 kJ |
<varies> |
Loud |
4 |
PPT=75W |
40 W |
195 s |
110 W |
48 oC |
21.5 kJ |
42.9 s |
110 W |
48 oC |
4.7 kJ |
<varies> |
loud |
5 |
PPT=50W |
40 W |
256 s |
85 W |
45 oC |
21.8 kJ |
68.8 s |
85 W |
45 oC |
5.8 kJ |
<varies> |
silent |
Messing with CoreBoost (CB) and Package Power Threshold (PPT) |
||||||||||||
6 |
CB-, Base |
40 W |
195 s |
165 W |
45 oC |
32.2 kJ |
36.8 s |
170 W |
45 oC |
6.3 kJ |
3500 MHz |
Silent |
7 |
CB-, PPT=125W |
40 W |
192 s |
155 W |
43 oC |
28.8 kJ |
37.1 s |
165 W |
44 oC |
6.1 kJ |
3500 MHz |
Silent |
8 |
CB-, PPT=100W |
40 W |
198 s |
135 W |
40 oC |
26.7 kJ |
39.1 s |
135 W |
39 oC |
5.2 kJ |
3200 MHz |
SILENT |
9 |
CB-, PPT=75W |
40 W |
205 s |
110 W |
36 oC |
22.6 kJ |
43.2 s |
115 W |
36 oC |
4.8 kJ |
2600 MHz |
SILENT |
10 |
CB-, PPT=50W |
40 W |
265 s |
85 W |
33 oC |
22.5 kJ |
67.7 s |
85 W |
32 oC |
5.7 kJ |
1500 MHz |
SILENT |
Messing with XMP profiles (some data points in this group are missing, because I was lazy) |
||||||||||||
11 |
XMP 3200, Base |
50 W |
157 s |
235 W |
54 oC |
36.9 kJ |
32.0 s |
230 W |
58 oC |
7.3 kJ |
3800 MHz |
LOUD |
12 |
XMP 3200, CB- |
50 W |
170 s |
200 W |
47 oC |
34.0 kJ |
34.2 s |
205 W |
48 oC |
7.0 kJ |
3200 MHz |
Silent |
13 |
XMP 3200, CB-, PPT=125W |
50 W |
173 s |
170 W |
45 oC |
29.4 kJ |
36.5 s |
170 W |
44 oC |
6.2 kJ |
3200 MHz |
SILENT |
14 |
XMP 3200, CB-, PPT=100W |
50 W |
186 s |
142 W |
40 oC |
26.4 kJ |
41.2 s |
140 W |
39 oC |
5.8 kJ |
2600 MHz |
SILENT |
15 |
XMP 3200, CB-, PPT=75W |
50 W |
244 s |
110 W |
37 oC |
26.8 kJ |
60.1 s |
110 W |
36 oC |
6.6 kJ |
1600 MHz |
SILENT |
16 |
XMP 3200, CB-, PPT=50W |
50 W |
616 s |
85 W |
34 oC |
52.4 kJ |
168.3 s |
85 W |
34 oC |
14.2 kJ |
550 MHz |
SILENT |
Video card takes around ~5 W, but it was inconvenient to run without it. So, both idle and active power figures include it. Wireless, Bluetooth, and Audio seem to take another 5 W combined, but those are disabled explicitly, and do not affect either idle or active power.
Interpreting The Results
The discussion below references the lines in raw data, like this "[1]". The time and power alone do not tell much about the efficiency, although we would not like to raise either time to complete or power requirements all too much. The thing we want to optimize is amount of energy spent doing the job. The table above conveniently has it in kilojoules.
First of all, Tctl offset of +27 oC made me really concerned, when both bios and old Ubuntu installation reporting
idle temperatures at +60 oC. I frankly thought I screwed up the thermal grease (this is a large CPU!), regreased,
and the temperatures stayed the same. Then I remembered about this whole temp offset thing, and sure enough, recent
Fedora installations report both Tctl and Tdie. Chip idles at 29 oC in 21 oC ambient, which is good.
With default settings, full load consumes quite a lot of power: up to 235 W at wall socket [1, 11]! Running it for a year at full load was going to cost me around 600 EUR, which I can spend better elsewhere. It also runs quite loud (more on this later), but not too hot.
Precision Boost settings in BIOS allows to manually override the wattage the platform is allowed to pump to the CPU package: Package Power Threshold (PPT). While I have seen most people increasing it to provide the headroom for overclocking, it can also be tuned down to deprive the package of power. In that case, the system starts to throttle. This can be seen with effective frequency going down.
Before messing with PPT, it seems that disabling Core Boost kicks out some steam from CPU, by disallowing it to get to frequencies above the nominal. It seems to correlate with significant reduce in power and the subjective loudness of the cooling system. Compare [1] with [6]: there are some benefits in allowing Core Boost for workloads with varying parallelism like OpenJDK build, and less benefit for flatlined. But, both power goes down, and efficiency goes up when CoreBoost is disabled. With 1.48x less power, we get only 1.10x longer builds.
Further trimming the PPT cuts the power and reaches the peak efficiency at around PPT=75..100W, see [2..5]. This adds
up to the CB disabling nicely [7-10]. It would seem that running the workloads that exibit significant low-parallelism
phases would be fine with CB enabled: while full package power is still limited, it can boost up individual cores to
get the extra kick. Unfortunately, that seems to correlate to significantly higher Tdie, even though the power itself
rises not very significantly, see for example [4] and [9].
Zen microarchitecture was reported to bind the internal interconnect frequency to the memory speed. Which apparently means that running at higher XMP profile makes Threadripper faster? This corroborated by experiments, see [1] and [11]. Running with XMP on stock settings does improve performance more than it degrades power, so overall efficiency gets higher.
However, this starts to bite us back as we try to downclock the thing. There, it seems that elevated power requirements for internal interconnect eat up the PPT budget and CPU starts to throttle much more aggressively, see [13..16]. The funny data point is [16] in comparison with [10], where CPU cores were apparently so deprived of power to run, the build times tanked 2.3x. Which, in turn, foobared the efficiency, because interconnect still consumed the same relatively huge amount of power for much longer time.
XMP profile seems to also increase idle power considerably.
Conclusion
After the first iteration of this experiment, I configured the server to run in configuration [9]: it runs decently fast (1.17x slower than stock) with much less power (2.1x lower than stock), which means 1.8x improvement in overall efficiency. Not only it makes the system whisper-quiet, even in absolute silence of the night, this also saves me around 300 EUR/yr in running costs, and keeps enough headroom for higher ambient temperatures in summer, and in denser racks. In fact, I was buying 2950X thinking to keep the case in the study room for better airflow, but now I wonder if with 110W power I might as well tuck it in the same storage closet as my old server, hm.
Other lessons learned. First, 750W PSU is probably way too much for this kind of system — and lower rated PSUs would reach their efficiency peaks at my target load. I think current PSU wastes around 5..7W right now, probably no biggie. Second, next time I can save up and not buy fast memory — I think I overpaid around 250 EUR on current one, without running it with XMP. Or I can find some solitude in believing that running memory below what’s it capable of would give me some reliability benefits.